In this installment, we show how to utilize the Master Bot Profiles to create and store API keys, along with exploring available scripts in the Hummingbot Dashboard. Let's break down the essentials!
The Master Bot plays a pivotal role in the credential management process in Hummingbot. It serves as a centralized location where exchange API keys and the scripts/strategies available to new bots are securely stored. When spawning new bots from the dashboard, they inherit the encrypted keys and available scripts/strategies from the Master Bot.
In the future, plans are in place to introduce additional bot profiles. Each profile can possess different API keys and available scripts, enabling users to specify the profile they want to use when spawning a new bot.
To test the Master Bot's functionality, we'll connect to the Binance exchange as an example:
Ensure Docker is running, as it's essential for spawning new bots.
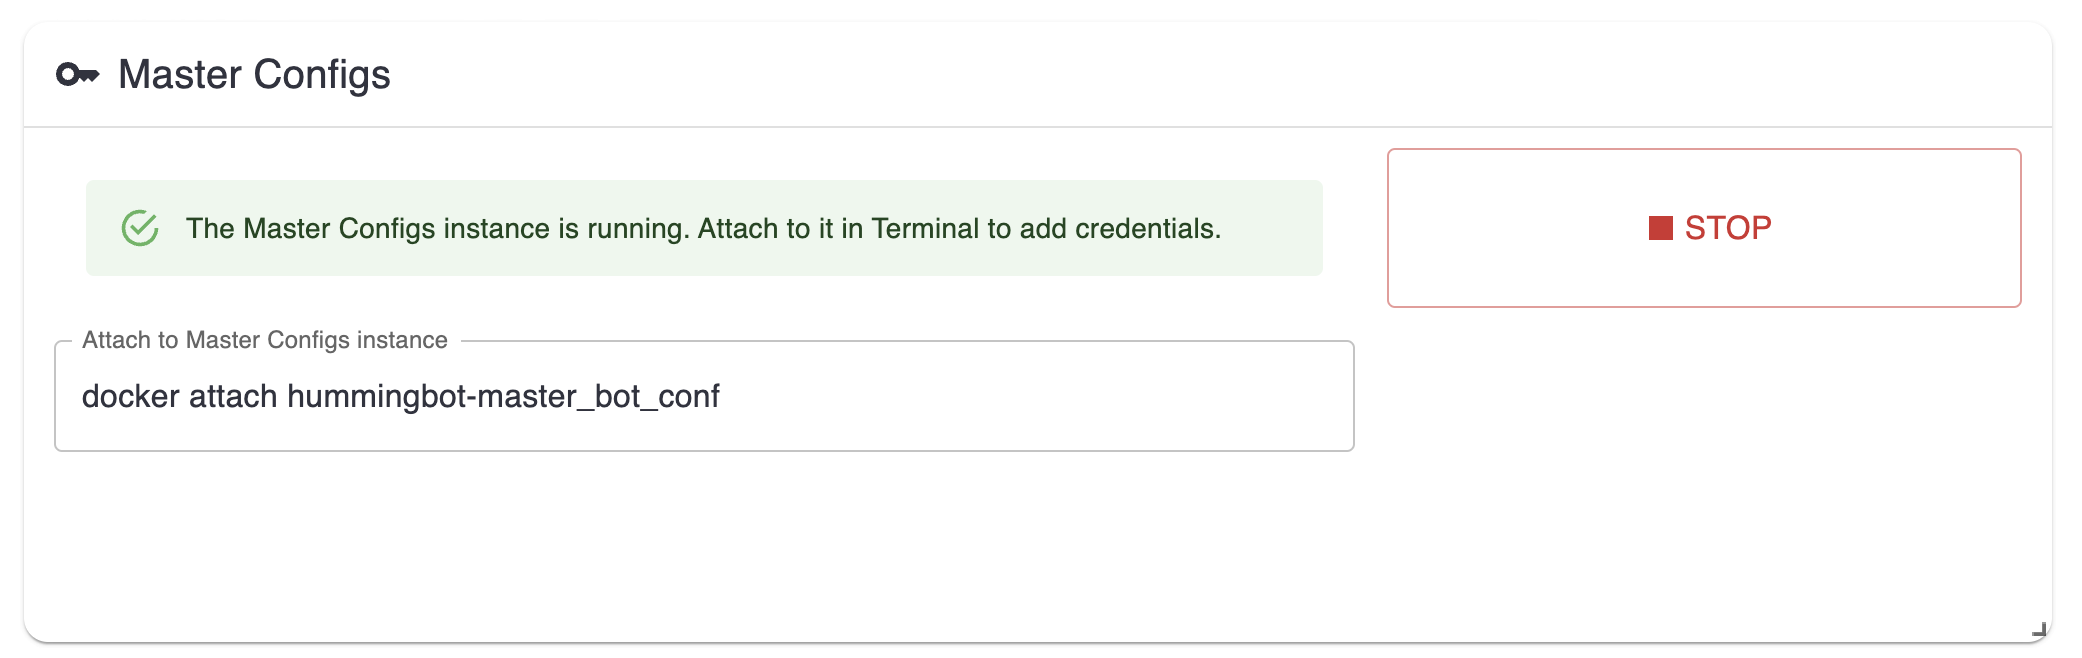
Navigate to the Credentials tab in the dashboard.
Click on the Start button to initiate the Master Bot.
Open a terminal and enter the command docker attach hummingbot-master_bot_conf to attach to the Master Bot.
Connect to the desired exchange (e.g., Binance) and input the required API keys using the command connect binance (replace binance wih the name of exchange you want to connect to).
The Hummingbot Dashboard offers a variety of pre-written scripts that can be utilized as templates for new bots. Here's how you can explore and modify them:
In the dashboard, navigate to the File Explorer.
Browse through available scripts. Those prefixed with "V2" are part of the V2 framework.
For deeper understanding and advanced configurations, consider joining the Bot Camp, which offers comprehensive training on these scripts.
Open any script to view its content. The built-in editor allows for direct modifications.
If you're more comfortable with an external IDE, you can edit scripts there and then upload them back to the dashboard.
The process of integrating credentials and leveraging available scripts is streamlined to ensure both security and efficiency. Whether you're editing scripts directly in the dashboard or using an external IDE, remember to save your changes to any scripts you modify.
If you make modifications in the dashboard's editor, use Apply button to apply changes, and then Ctrl + S to save.
The Master Bot Profile ensures the secure handling of credentials and offers users flexibility in creating bots. Next, learn how to create and manage new instances:
In this tutorial, we'll dive into the process of spawning new bots, starting a strategy, making modifications, and running one for a set duration. Let's get started!
On the instances page, to the right, you'll notice the Hummingbot broker. Before creating any bot, it's essential to start this broker. This component is responsible for enabling communication between the dashboard and the bot, facilitating commands such as starting or stopping a strategy.
On the left, you'll find the creation card. Here, you'll input:
Name of the container
Desired Docker image (useful if you have a custom Hummingbot version with unique strategies)
Profile to start from (for now, only the master bot is available, but more profiles will be added in the future)
Once a bot is created, a card will appear allowing you to select a strategy from those available. After choosing a strategy, press "Start" to launch the bot with the selected strategy.
The strategies available for selection are the same ones present in the master bot. Once you've chosen one, simply press "Start," and the bot will initiate with your chosen strategy.
Below the instances page, the file explorer allows users to view and modify the specific scripts or files for each bot they create. Each bot has its distinct set of scripts that can be adapted to fit specific trading requirements or strategies.
First, import your trading data by uploading the SQLite database file associated with your trading strategy.
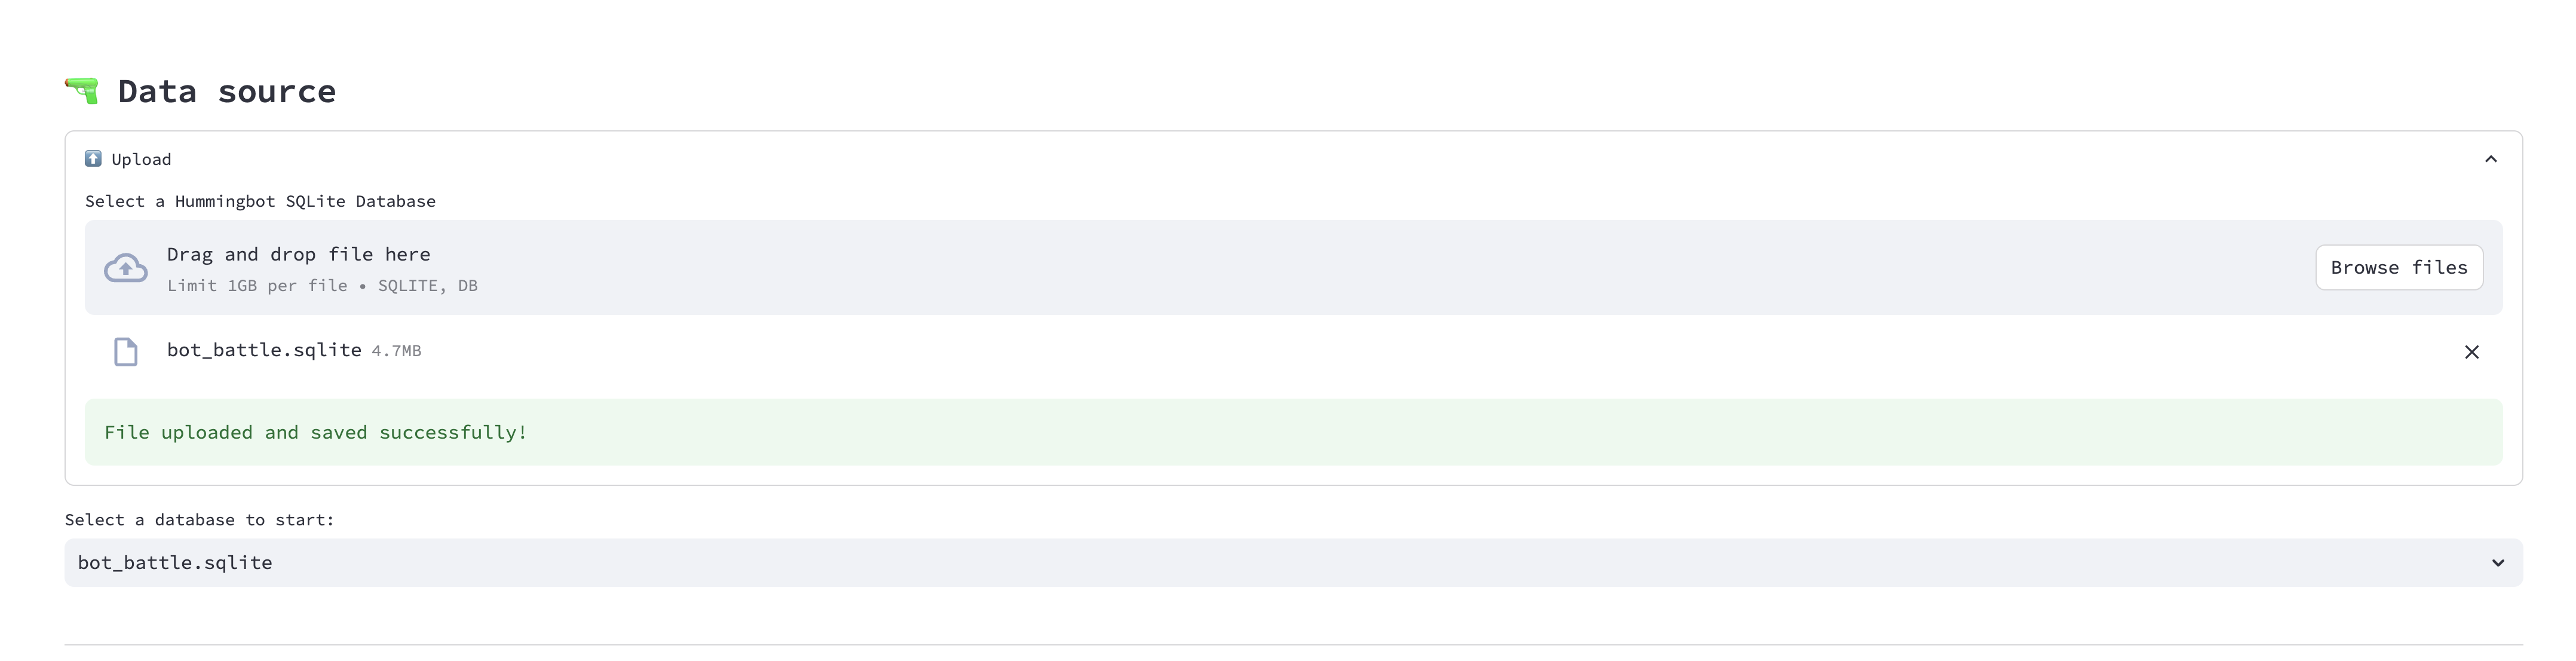
Locate the SQLite Database File: Navigate to the /data folder of your Hummingbot instance. Here, you'll find the SQLite database file named after your trading strategy. For instance, in the provided screenshot, the strategy's name appears to be bot_battle, hence the file bot_battle.sqlite.
Upload the Database File: Drag and drop the SQLite database file into the designated area in the Hummingbot Dashboard. Alternatively, click on "Browse files" to manually search for and select the SQLite database file from your computer.
File Confirmation: After successfully uploading, you'll see a confirmation message stating "File uploaded and saved successfully!".
Select Database: Once uploaded, select the database file from the dropdown menu (e.g., bot_battle.sqlite) to begin analyzing the performance of your trading strategy.
Note
Ensure the database file size does not exceed 1GB.
Continue with the next steps in the Hummingbot Dashboard to dive deeper into your strategy's performance metrics and insights.
With Dashboard's auto-identification feature, the pairs and exchanges in the database file are recognized automatically. Users can then effortlessly select the desired trading pairs for in-depth analysis, streamlining the decision-making process.
The Market Activity Widget provides a detailed visualization of the market's activity over a specific time interval. It allows users to get an in-depth understanding of various metrics including buy/sell orders, profit/loss, and inventory changes.
Usage:
Candles Interval: Use the dropdown to select the desired interval for the candlestick data. Options might include timeframes like 1m, 5m, 15m, etc. This selection determines the granularity of the candlesticks shown in the chart.
Candles per Page: Adjust the number of candlesticks displayed on a single page by changing this value. This can help in narrowing or expanding the time frame viewed at once.
Show Panel Metrics: Click on this button to toggle additional metrics on or off, providing a cleaner or more detailed view based on your needs.
Price Chart: Visualizes the price movement, buy/sell orders, and other metrics over the selected time range. Drag your mouse to get detailed information over a window.
PnL Chart: This chart displays Profit and Loss over time, giving a clear indication of market performance. Positive values show profit, while negative values indicate a loss.
Quote Inventory Change: Provides a bar graph representation of how your the value of your quote assets as a percentage of the overall value of your base and quote assets percentage changes over time, assisting users in identifying significant inventory shifts.
In this chapter, we delve deep into one of the most critical aspects of bot trading: backtesting strategies using historical data. Dashboard provides a comprehensive framework that helps you do everything from downloading historical data to backtesting strategies and optimizing hyperparameters.
First things first, you need historical data to backtest a trading strategy. Dashboard helps you fetch OHCLV candle data from certain exchanges. You can define the exchange, specify trading pairs (separated by a comma), select the time intervals, and choose the number of days for which you want the historical data.
Clicking the "Get data" option will initiate a Docker container running a script that downloads the desired data. The data will be stored in the data folder, in the candles subfolder.
Once you have the data, the next step is to define a strategy controller template for backtesting. The "Create" tab showcases a list of available controller templates.
Current examples include directional strategies such as bollinger v1, macd bollinger v1, and trend following v1, as well as market making strategies such as dman_v1, dman_v2, and dman_v3. You can also create and add your own custom controller.
In the video, we take a deep dive into optimizing the bollinger_v1 controller, which defines a directional trading strategy that uses Bollinger Bands to determine potential buy and sell signals. The strategy considers factors like the length of the Bollinger band, the number of standard deviations, and specific thresholds for taking long or short positions.
Using the Optuna framework, Dashboard can fine-tune hyperparameters automatically. By selecting a strategy and defining specific optimization parameters, you can initiate the optimization process. The system will then try out numerous combinations of parameters to find the most profitable set.
To demonstrate the entire process, we take the example of optimizing the near-usdt trading pair using 120 days of historical 3-minute candles data.
We download the candles data which will be saved inside the /data/candles folder.
Go to the Create page amd select one of the directional strategies. You can use the same values included in the video or use your own.
Next in the Optimize screen, select the strategy name and click Create, change the pair to near-usdt and modify the desired values in the script and save the file.
Select the study name and enter the number of trials and click Run.
Upon completion of optimization, you'll be presented with the results, showing which trials yielded the best net profit and loss (PNL). This gives you a clear understanding of which strategy parameters work best.
As we conclude this chapter, we set the stage for the next one, where we will analyze the results in-depth using the Hummingbot dashboard and deploy the most promising strategies for real-time trading.
Upon completion of the optimization process, it's time to visualize the results. By selecting a specific experiment, you're presented with a scatter plot showing the net Profit & Loss (PnL) on the Y-axis and the maximum drawdown on the X-axis. Each dot on this plot represents a unique combination of strategy parameters. Hovering over these dots reveals detailed information about each experiment.
When you've identified a promising trial, you can move on to a more granular analysis. By choosing a specific trial, you can view its performance on candlestick charts, giving you a clearer picture of how the strategy would have performed historically.
If a particular configuration resonates with your trading objectives and you believe it's worth deploying, you can save it for later use. This step involves selecting the strategy, viewing its performance, and then saving the configuration for deployment.
You can repeat this process for multiple configurations, allowing you to cherry-pick the best ones for real-time trading.
After saving your preferred configurations, navigate to the Deploy page. Here, you can select the configurations you wish to deploy, assign a name, and initiate the deployment process directly from a controller configuration. Under the hood, this uses a generic script to launch the strategy, so you just need to manage the controller configuration file.
In this live demonstration, we analyze the optimization results for a particular trading pair. We observe the performance of various configurations, considering factors like take profit, stop loss, and time limits. This hands-on approach gives you a practical understanding of how to interpret results and make informed decisions.
After selecting the desired configurations, we demonstrate how to deploy them. These strategies are then run simultaneously, offering a more consistent trading performance that averages out the outcomes of all chosen strategies. This method helps avoid overfitting, ensuring a more stable trading experience.
In conclusion, this chapter equips you with the tools and knowledge to evaluate optimization results critically and deploy the best-performing strategies for real-time trading. It emphasizes the importance of a balanced approach, ensuring that you don't overly rely on a single configuration but rather diversify for better consistency.
Thank you for following along with this series. Your dedication and time spent learning about Dashboard and its various functionalities are greatly appreciated!
Throughout this series, we covered a range of topics, including:
Setup and Credentials: We walked through the initial steps of setting up, connecting credentials, and managing the credentials of the HummingBot instances and dashboard.
Deploying and Managing Bots: You've learned how to deploy new bots and execute various strategies effectively.
Backtesting and Optimizing Strategies : An in-depth exploration of the dashboard's latest features was provided, emphasizing backtesting, optimization, and deployment.
If you're serious about delving deeper and enhancing your trading bot capabilities, consider Botcamp, a professional training program for market makers and algo traders. This comprehensive program combines new content modules and live sessions each month to help you understand the intricacies of the market. You'll learn to create and backtest market making strategies, directional trading, and other strategies using Dashboard.
Most importantly, you'll gain hands-on experience with Bot Battles, Botcamp's monthly bot trading competitions. It's a great opportunity to measure your progress and learn from others. In addition, joining the Botcamp community allows you to expand your professional network, form teams to compete together, and share insights.
Thank you once again for joining us on this journey. I hope the knowledge you've gained here serves you well in your trading endeavors. All the best with your future trading bot projects!
Welcome to the inaugural post in our Strategy Experiments series, where we publish hypotheses, code, and performance analyses of live bot strategies.
We're thrilled to return to the Hummingbot blog with an exciting experiment: developing a crypto trading bot using the open-source Hummingbot platform. This bot employs an indicator-based directional strategy on the Binance Futures exchange, leveraging MACD and Bollinger Bands.
As the first entry in our Strategy Experiments series, we aim to foster a collaborative environment where users can share their strategic insights with the community, enhancing growth and knowledge exchange among quantitative traders.
We invite everyone to contribute their Strategy Experiments, regardless of outcome, as there is valuable learning in each experience. Through sharing insights and discussing novel concepts, we aspire to cultivate a vibrant ecosystem for continual improvement and refinement of trading strategies.
Below is a detailed account of our first experiment. You can watch the accompanying video or read the following description.
Welcome to the new Hummingbot Quickstart Guide! This will teach you how to build and customize market making strategy using Hummingbot over 5 exercises.
Whether you're a beginner or an experienced trader, this guide should help you get started with creating your own custom trading strategies using Hummingbot. So, let's dive in and start building!
Note
Introduced in version 1.4.0, Scripts enable users to build customized strategies and access the full power of Hummingbot exchange connectors without creating a full-blown strategy. Scripts are light Python files that can be run and modified without re-compilation, which let users can stop a script, adjust the code, and start it without leaving the Hummingbot client interface. See Examples for a list of the current sample scripts in the Hummingbot codebase.
First, check out the Installation section to install Hummingbot. You may install it using Docker (easiest for new users) or from source (best for developers).
If you have questions or need help, join the official Hummingbot Discord and ask for help on the #support channel from our community.
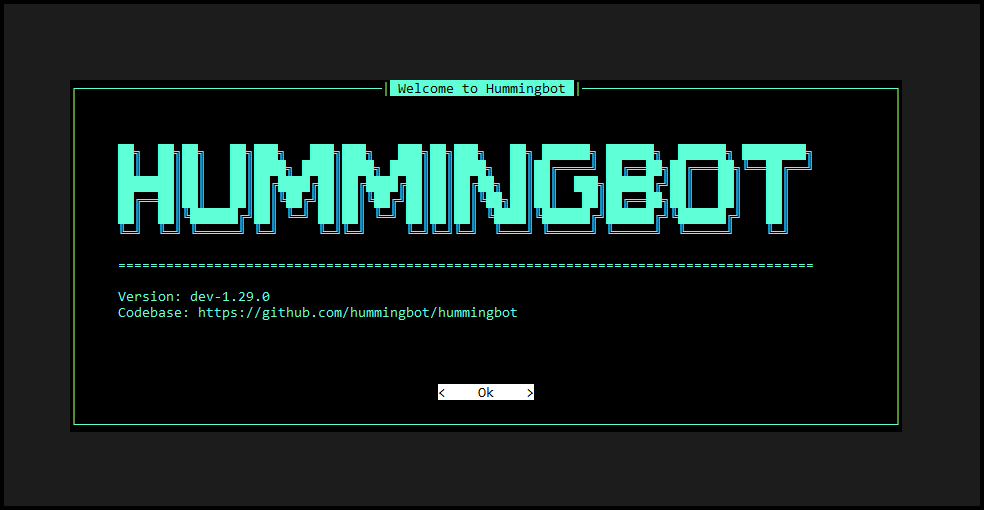
If you have installed Hummingbot successfully, you should see a welcome screen like the one below:
The Hummingbot CLI helps you manage, configure, and run your bots. Familiarize yourself with the basic features in Hummingbot, especially the User Interface.
We will start with a simple "Hello World" example of a Hummingbot script and gradually add more functionality to it with each exercise. By the end, you should gain a basic understanding of how to create a market making strategy and use market data to customize its behavior.
Open the codebase in your favorite IDE such as VSCode or PyCharm and follow the steps below:
Create a new file inside the scripts folder and name it quickstart_script.py
Add the following code to the quickstart_script.py file:
fromhummingbot.strategy.script_strategy_baseimportScriptStrategyBaseclassQuickstartScript(ScriptStrategyBase):# It is recommended to first use a paper trade exchange connector # while coding your strategy, and then switch to a real one once you're happy with it.markets={"binance_paper_trade":{"BTC-USDT"}}# Next, let's code the logic that will be executed every tick_size (default=1sec)defon_tick(self):price=self.connectors["binance_paper_trade"].get_mid_price("BTC-USDT")msg=f"Bitcoin price: ${price}"self.logger().info(msg)self.notify_hb_app_with_timestamp(msg)
The on_tick method runs for every tick that the bot internal clock executes. By default, the tick_size is 1 second, and you can adjust this parameter in the global conf_client.yml config file.
All the connectors that you defined on markets are initialized when the script starts. You can access them in the class by calling self.connectors, which is a dictionary with the following structure: Dict[CONNECTOR_NAME, ConnectorBase].
To get the mid-price of Bitcoin, we are using the connector binance_paper_trade by calling the get_mid_price method, i.e. self.connectors["binance_paper_trade"].get_mid_price("BTC-USDT")
The logic to get the mid-price for any connector is: self.connectors[CONNECTOR_NAME].get_mid_price(TRADING_PAIR). Make sure that you define the connector and trading pair in markets before using them.
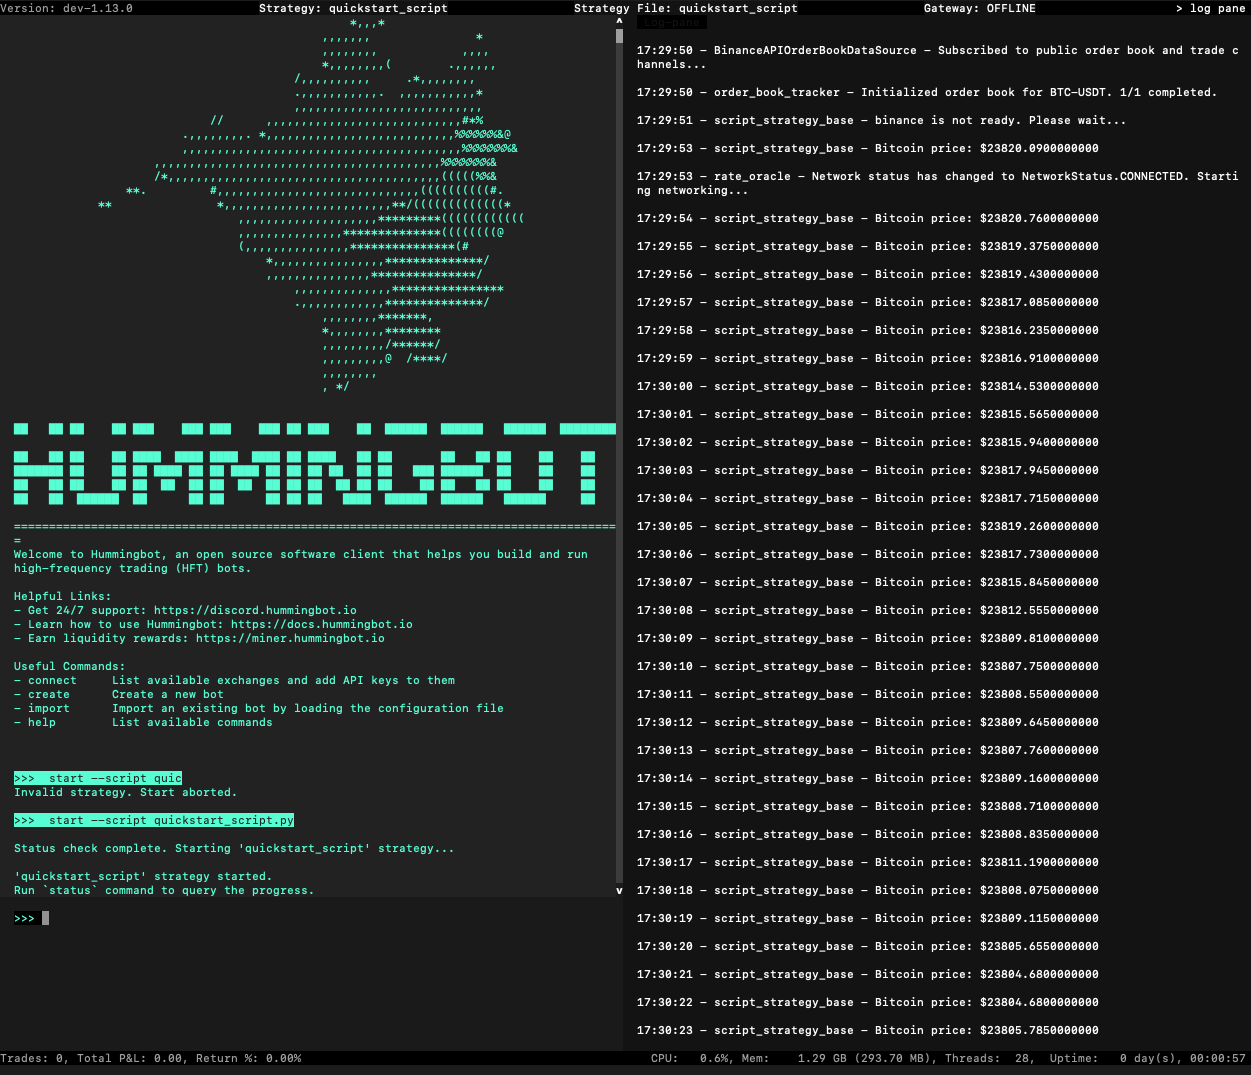
self.logger().info(msg) prints the message in msg to your Hummingbot log panel (right hand pane) and saves it to the log file, which is in logs/log_quickstart_script.log .
self.notify_hb_app_with_timestamp(msg) sends the message to the Hummingbot output panel (top left pane). If you have set up Telegram bot integration, you will get the message on your Telegram chat as well.
If you installed Hummingbot from source, you should open Terminal/Bash and run the client with ./start (make sure to run conda activate hummingbot first).
You will see a sqlite database (/data/quickstart_script.sqlite) and a log file (/logs/log_quickstart_script.log) created for your script
Your script is loaded up at runtime, so you don’t have to exit Hummingbot while you are updating your script code. You will just need to stop (to stop the current execution) and start it again with the command start --script script.py again.
Tip
💡 If you have already run the script and the file name is in the top status bar, then you can run it again with just the start command instead of adding the script name.
If you want to use a real connector instead of a paper trade one, first you need to configure it using the connect command and provide all the required API credentials. See https://docs.hummingbot.org/client/connect/ for more details.
Use the ↑ key in the client to cycle through the list of previous commands
Use DBeaver or another free database management tool to open the sqlite database to see what the data that Hummingbot stores for you.
Add a new file inside the scripts folder: quickstart_script_2.py
Open the file in your IDE editor and add this code to it:
importloggingfromdecimalimportDecimalfromtypingimportListfromhummingbot.core.data_type.commonimportOrderType,PriceType,TradeTypefromhummingbot.core.data_type.order_candidateimportOrderCandidatefromhummingbot.core.event.eventsimportOrderFilledEventfromhummingbot.strategy.script_strategy_baseimportScriptStrategyBaseclassQuickstartScript2(ScriptStrategyBase):bid_spread=0.008ask_spread=0.008order_refresh_time=15order_amount=0.01create_timestamp=0trading_pair="ETH-USDT"exchange="binance_paper_trade"# Here you can use for example the LastTrade price to use in your strategyprice_source=PriceType.MidPricemarkets={exchange:{trading_pair}}
We define the variables that the script will use:
bid_spread and ask_spread calculate the price of our orders by applying a spread to the market price
order_refresh_time and create_timestamp define when to cancel open orders and place new ones
order_amount is the amount in units of the base asset (ETH in this example) for our orders
price_source define how the market price is retrieved using the get_price_by_type method. The options for PriceType are:
MidPrice
BestBid
BestAsk
LastTrade
LastOwnTrade
Custom (if you are using a custom API to get the price)
trading_pair and exchange will be used to initialize the markets, as we saw in the previous example.
The method get_active_orders gives you a list of the active limit orders.
We are going to cancel each order by calling the method self.cancel(connector_name, trading_pair, client_order_id)
We are using the information of trading_pair of the LimitOrder and the client_order_id which is an internal order id that Hummingbot generates before sending the order.
First, we are getting the reference price (in this case MidPrice) which we are going to use to calculate the bid and ask prices, by multiplying it with the bid and ask spread.
Then we are creating two OrderCandidate's and return them inside a list.
Here, we are looping over the list of order candidates, and then we are executing the method place_order which is the one that we are going to explain next.
Based on the side of the order we are going to call the method buy or sell of the strategy.
It is important to execute the buy and sell methods of the strategy because the logic of the order tracking is encapsulated there. If you buy or sell directly with the connector, you are going to loose the tracking of the order by the strategy.
defdid_fill_order(self,event:OrderFilledEvent):msg=(f"{event.trade_type.name}{round(event.amount,2)}{event.trading_pair}{self.exchange} at {round(event.price,2)}")self.log_with_clock(logging.INFO,msg)self.notify_hb_app_with_timestamp(msg)
Finally, let’s define a handler for a Hummingbot event. You can use them to create custom logic to handle event if the event happens!
Hummingbot has the following events implemented:
did_fill_order
did_complete_buy_order
did_complete_sell_order
did_cancel_order
did_create_buy_order
did_create_sell_order
did_fail_order
In this case, we are just logging the message and sending the notification to the app.
Optional Exercise:
💡 Try to implement handlers for these other events and print log messages when they occur!
As before, open a terminal and run the client with ./start (Make sure that the conda environment is activated)
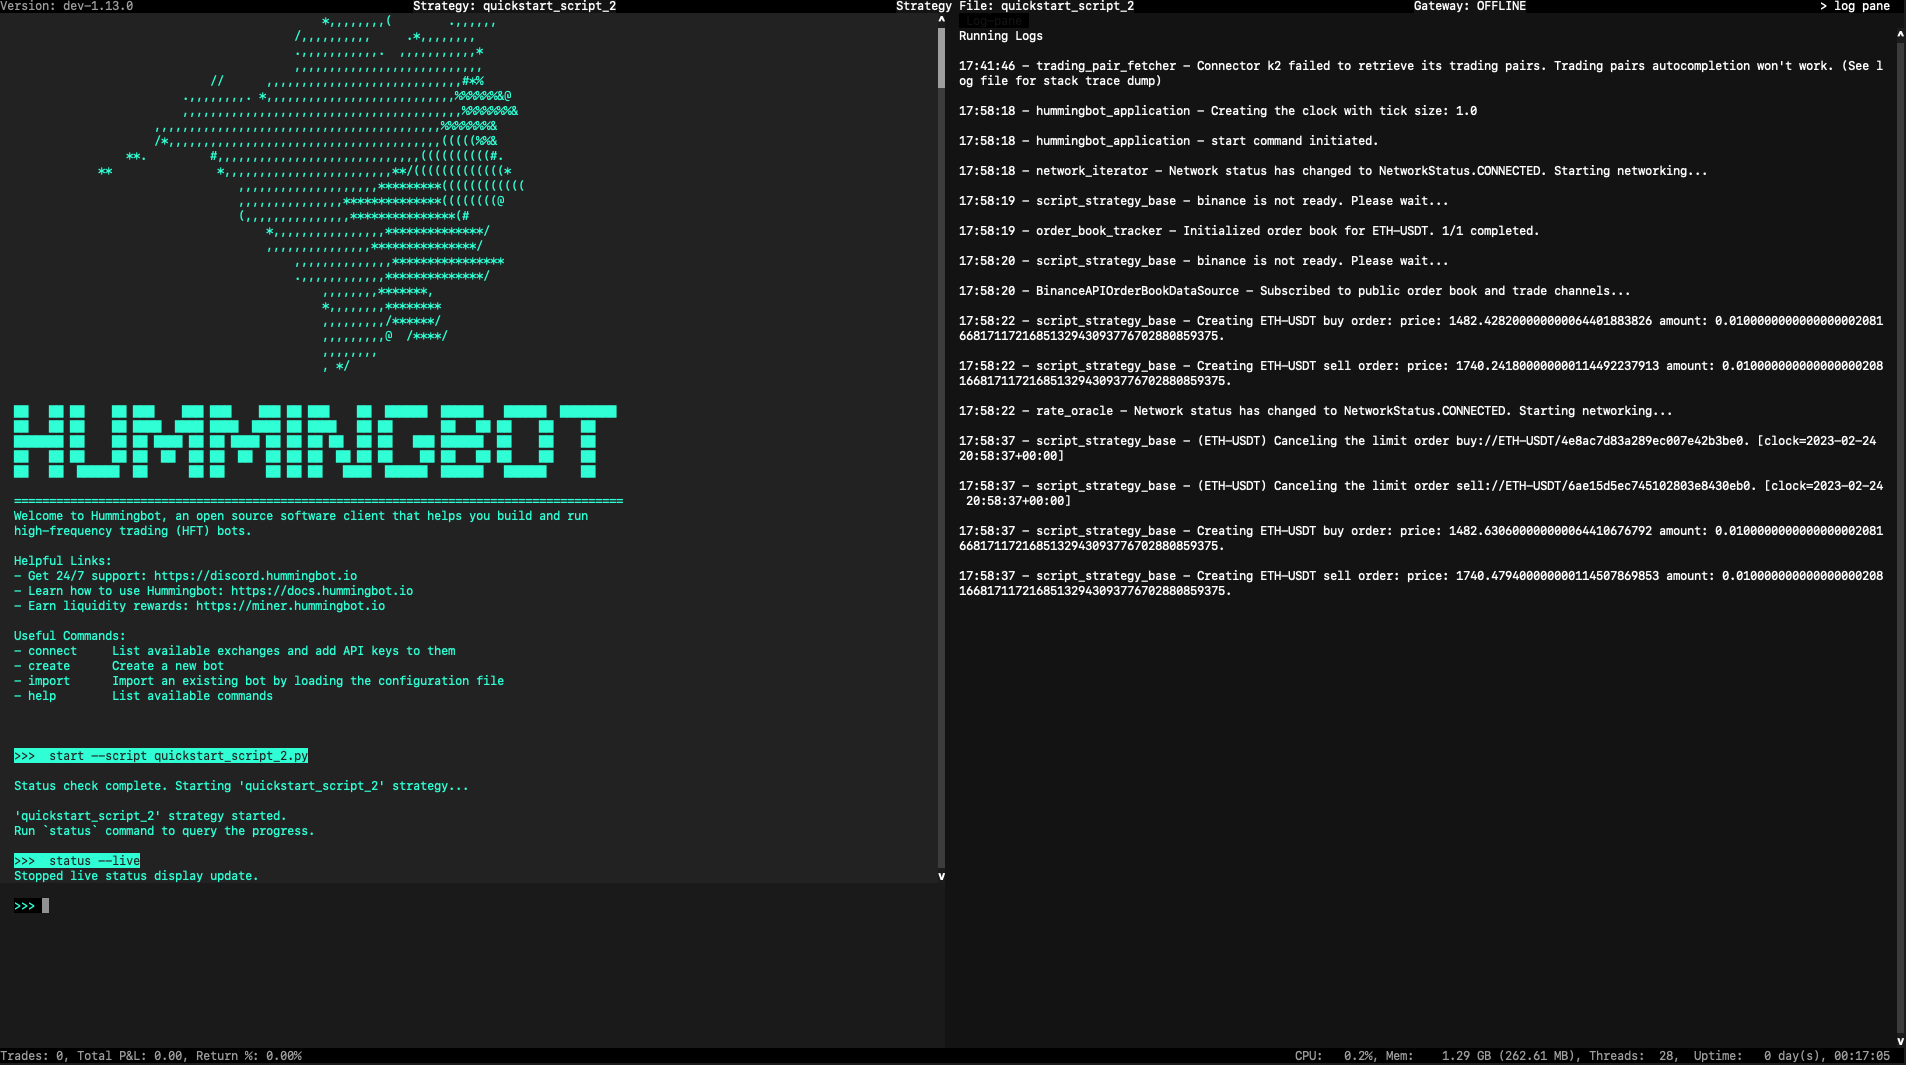
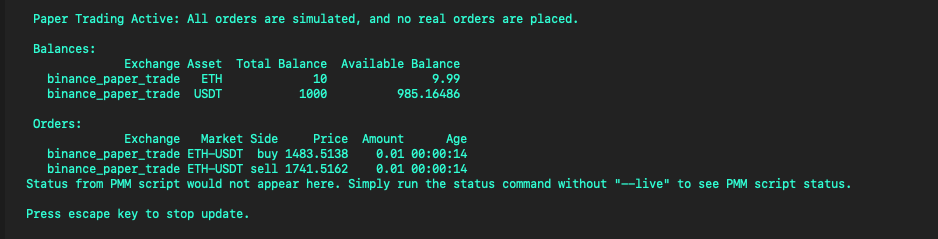
Start the script with the command: start --script quickstart_script_2.py.
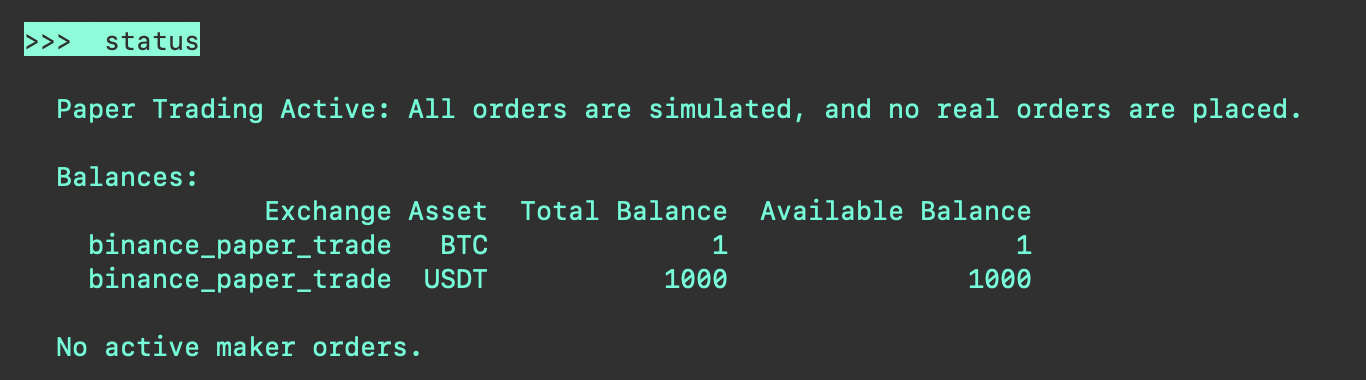
Run the command: status --live and you should see:
Run the history command to see all the trades that you have performed and the current profit/loss. This performance is measured by comparing the value of your current assets with the value if no trades had happened. See this blog post for details.