Using Debugger Tools
This section will detail the necessary configuration / setup required to run the debugger tool from your IDE of choice.
VS Code
-
In VSCode, open the Hummingbot folder as your current workspace.
-
Click on the Run and Debug icon in the left-hand pane or press CTRL + Shift + D.
-
Click on the blue link for create a launch.json file
-
Select "Python Debugger" and then "Python File"
-
A window will open up containing the initial
launch.jsoncode. Replace this code with the one provided below: -
Save the changes.
-
Press CTRL + Shift + P and select "Python Interpreter."
-
Make sure to select the Hummingbot conda environment.
By executing the Start Debugging command which can be found under the Run menu at the top or pressing the F5 key, the debugger will automatically attach itself to the Hummingbot process. The Hummingbot app will appear in the integratedTerminal. You may change this as desired.
Using VSCode with WSL2 (Windows)
- Make sure you have Visual Studio Code on the Windows side (not in WSL).
Note
When prompted to Select Additional Tasks during installation, be sure to check the Add to PATH option so you can easily open a folder in WSL using the code command.
- Install the WSL extension
There are two ways you can open a remote folder / workspace
From the WSL Terminal:
-
Open a WSL terminal window (using the start menu item). For example, if you installed the
Ubuntudistro then you can search for "Ubuntu" in the start menu. Or you can also type inwslfrom the command prompt / PowerShell. -
Navigate to the folder you want to open in VS Code, for example the
hummingbotrepo folder. -
Type
code .in the terminal. When doing this for the first time, you should see VS Code fetching components needed to run in WSL. This should only take a short while, and is only needed once.
From VS Code:
-
Press F1 then select WSL: Connect to WSL for the default distro or if you have multiple distros installed then select WSL: Connect to WSL using Distro to choose between your installed distros.
-
Use the
Filemenu to open your folder, for example thehummingbotfolder if you already cloned the repo in the terminal.
PyCharm
In the video below, Abel of CoinAlpha has shown how to debug a Script using Pycharm IDE.
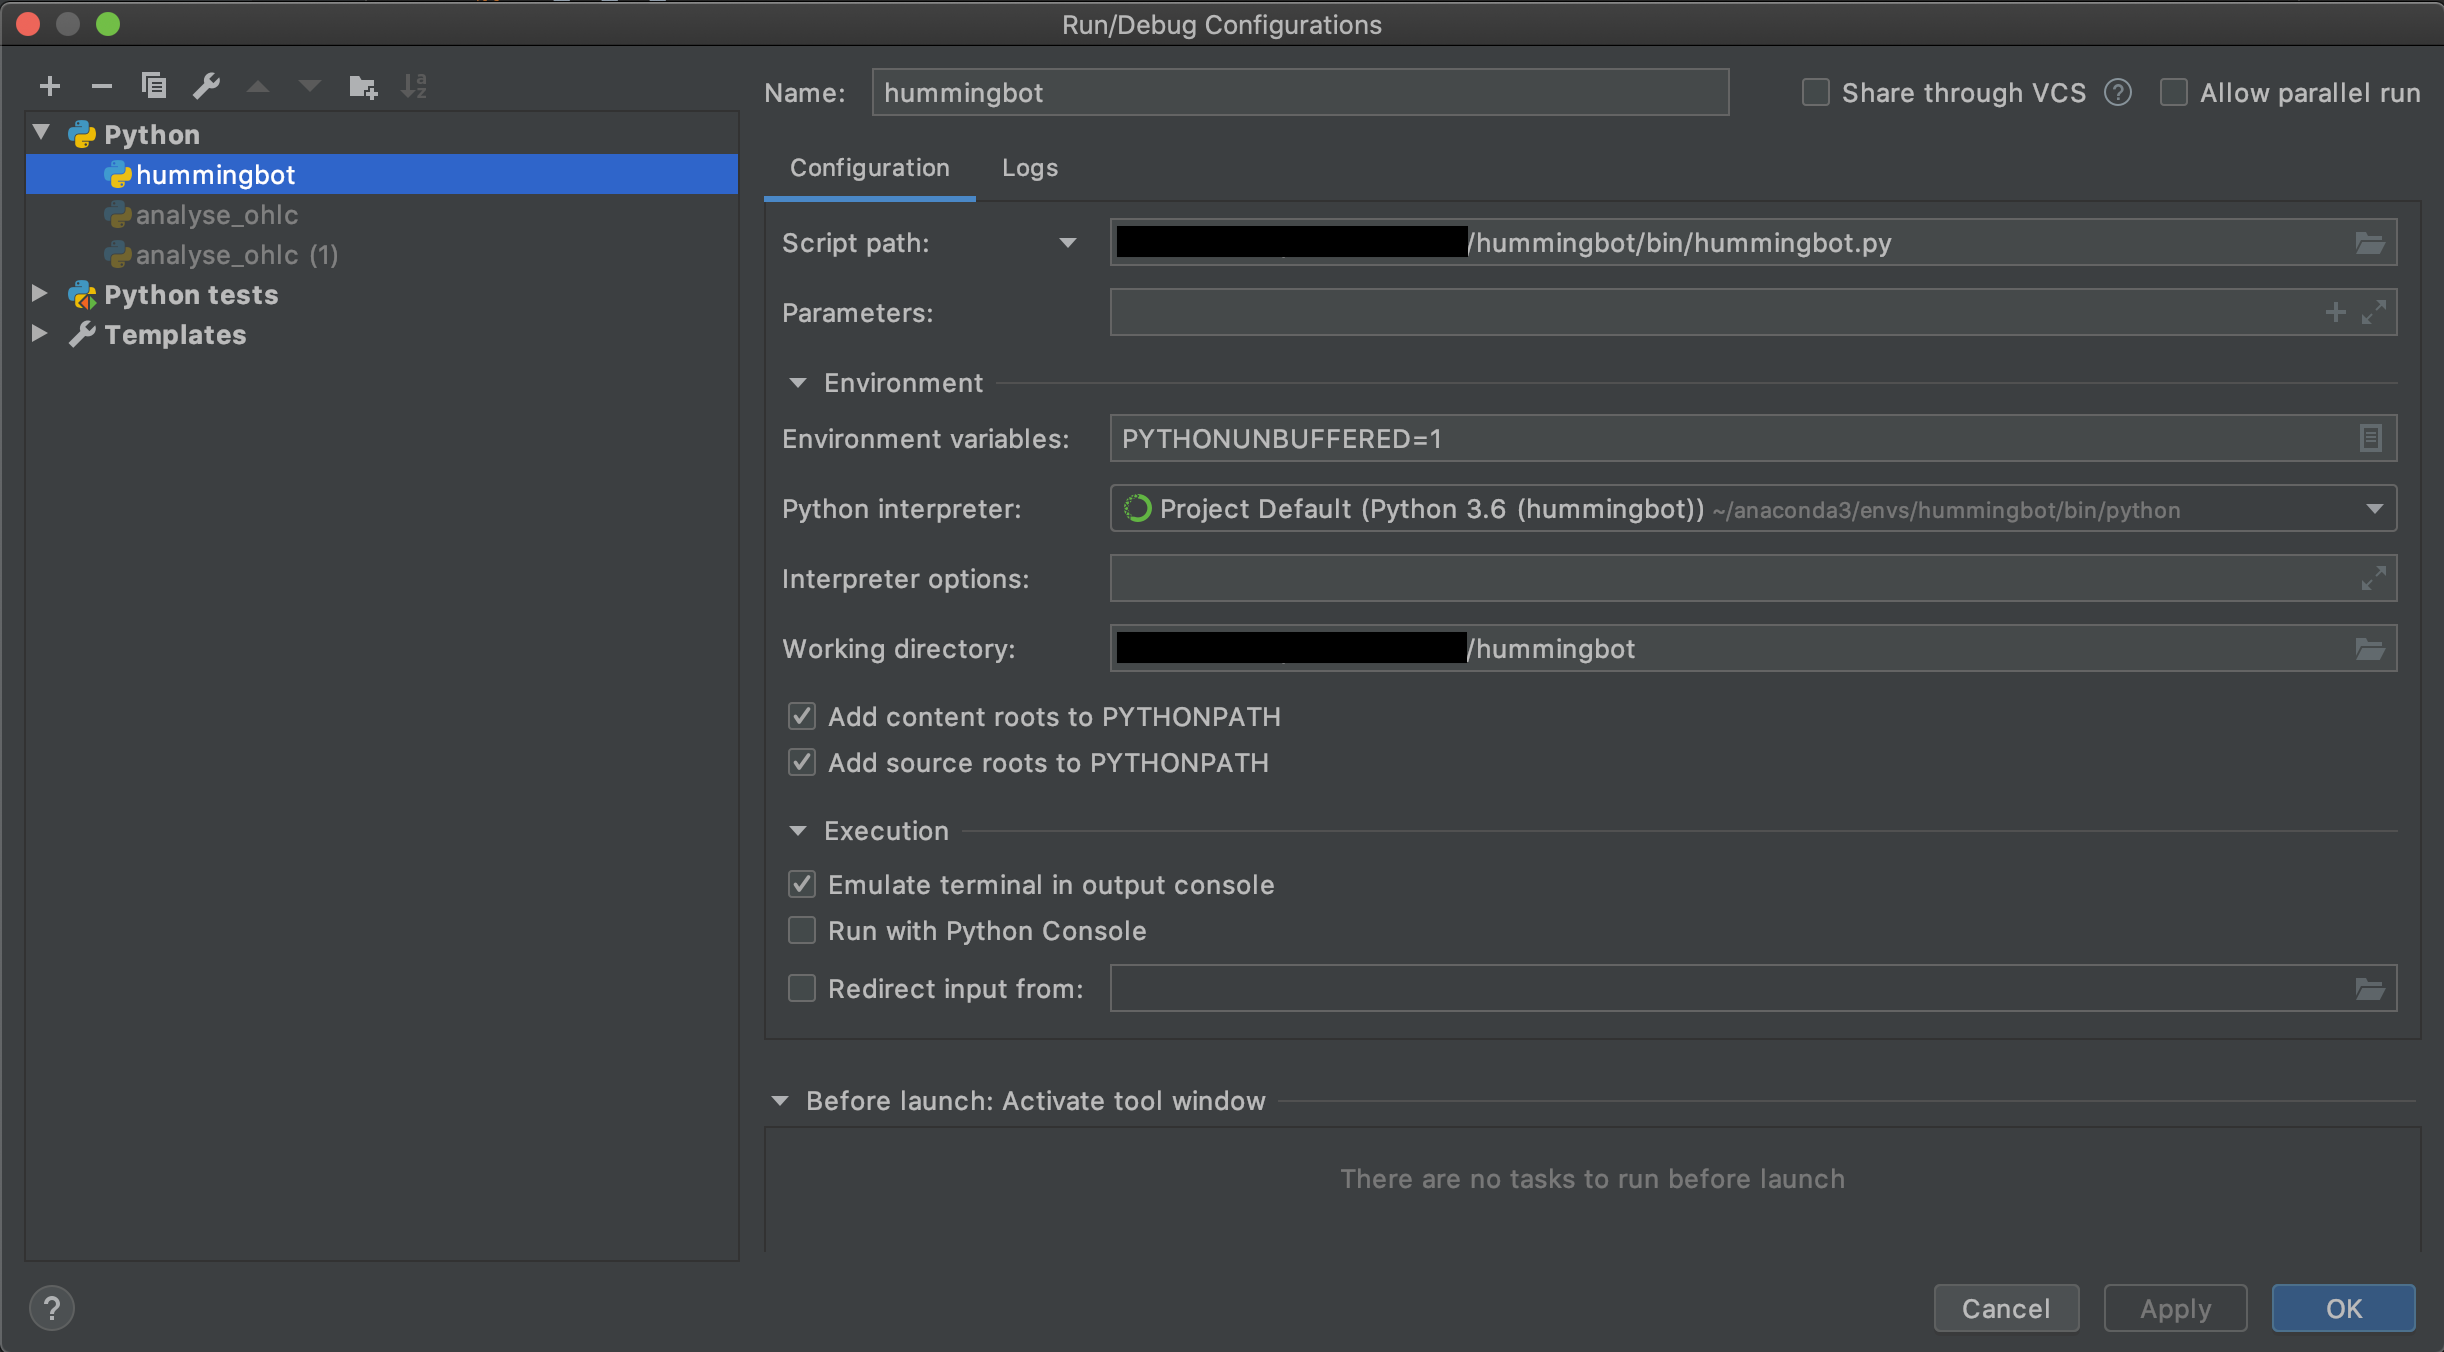
Additionally, for PyCharm, you want to set up the debug configurations, as seen in the screenshot below.

For debugging it is neccessary that Gevent compatible in Python Debugger settings is enabled. See
Stackoverflow Q&A.
Note
As of this writing, there is no way to add breakpoints/log points to any of the Cython code in VSCode or PyCharm.

